
Blue means a trend is moving in a positive direction.
College Financial Health Tracker
Search for a college or university below to see how its finances and enrollment have changed over time.
A Guide to Using This Tool
Use this tracker to look at the big picture.
- Once you search for a university, you’ll see its financial profile.
- Scroll down to learn about different financial and enrollment indicators.
- The colored boxes can help you spot patterns.
- Red means a trend is heading in a concerning direction.
- Move your mouse over a warningHere is a sample pop-up message for a warning sign. sign to learn more about what it means.
- One or two red boxes do not automatically mean a school is in crisis.
- But if a college shows several red indicators across revenue, enrollment and losses, that may be a sign of deeper financial pressure.
- Look for the Significant enrollment declines and losses indicator at the top of a profile. That means the college posted declines of at least 10% in both enrollment and net tuition revenue per FTE since 2019 and had operating losses in at least three of the latest five available finance years.
- A gold At least 6 warning signs badge means at least six of the visible warning indicators on that profile are flagged as concerning.
Click on the tabs at the top of the page to learn about colleges that have:
- announced cuts to programs or staff,
- faced sanctions from accreditors,
- or had federal research dollars terminated since 2025.
More questions about using this tool? Keep reading.
How to search
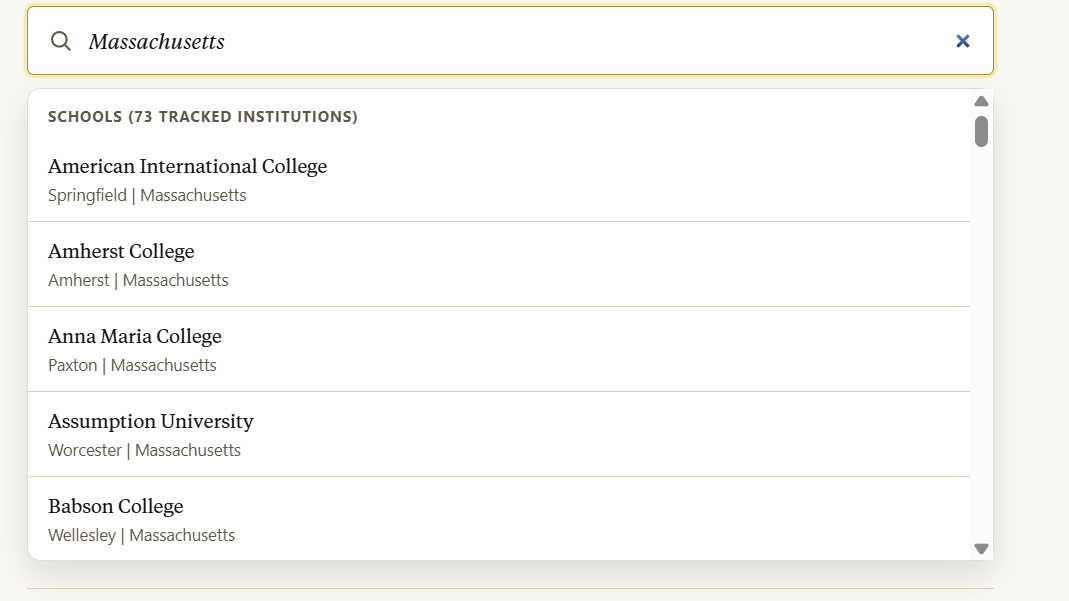
Search by college name, nickname, city or state.
For example: If you type in Massachusetts, you'll see all the colleges included in our tracker in that state.
You can also search by nicknames like CalTech, MIT or Georgia Tech.
What the Colors Mean
Red means a trend moved in a more concerning direction.
Yellow means there was no, or only a minor, change.
For detail on how we define a concerning or positive change, head to our methodology.
Here are some examples of what information you may see on a profile:
Significant enrollment declines and losses
At least 6 warning signs
Example University
Financial trends
Read a school’s guide to learn about what each financial and enrollment data point means, and why it matters.
Revenue decreased 19% from 2019 to 2024, after adjusting for inflation.
Net tuition revenue per full-time equivalent student decreased 23% from 2019 to 2024, after adjusting for inflation.
Enrollment trends12-month unduplicated headcount
Endowment valueAdjusted for inflation
How many times has this institution ended the year with a loss in the past decade?
8
Did enrollment decline by at least 1% in 3 of the previous 5 years?
Yes
This example school profile has almost all red boxes.
Revenue and enrollment are dropping significantly, and it has ended eight of the past 10 years at a loss.
This suggests deeper financial distress.
Example State College
Financial trends
Read a school’s guide to learn about what each financial and enrollment data point means, and why it matters.
Revenue increased 12% from 2019 to 2024, after adjusting for inflation.
Net tuition revenue per full-time equivalent student decreased 12% from 2019 to 2024, after adjusting for inflation.
Enrollment trends12-month unduplicated headcount
Endowment valueAdjusted for inflation
Did this college end the latest year at a loss?
No
How much has state aid changed since 2019?
+3%
This example college profile has one red box but mostly blue and yellow ones.
That suggests the college has a fairly stable financial picture.
Where to look next
Graduation rate, bachelor's degree within 6 years
No data
Median earnings, 10 years after enrolling
No data
Median federal loan debt for graduates
No data
Revenue trends
Revenue trends are a key indicator of whether a college is bringing in enough money to cover expenses. Examples of revenue include tuition, room and board, government aid, donations and endowment returns.
A college that spends more than it brings in is operating at a loss. Repeated losses can be a warning sign.
Has this college been in the red in 3 of the last 5 years?
How many times has this institution ended the year with a loss in the past decade?
Net tuition revenue
Net tuition revenue shows how much money a college brings in per full-time equivalent student after institutional aid and other kinds of discounts.
When net tuition revenue falls, it can put pressure on college finances. But it can also mean a college is giving students more aid and lowering what they pay.
Increased dependence on tuition can make a college more financially vulnerable when enrollment drops.
Enrollment
Drops in enrollment can be an early warning sign of financial stress.
Did enrollment decline by at least 1% in 3 of the previous 5 years?
Congress has capped federal loans for new graduate students starting July 1, 2026. This change could hit colleges with higher rates of graduate students who borrow.
International students
Institutions with higher international students enrollment may be more vulnerable to the federal push to make student visas harder to obtain.
Staffing
Drops in staffing can signal that a college is cutting back as a result of financial and enrollment challenges.
Endowment
Some colleges may have an endowment they can draw on for difficult financial periods.
Some universities report how much of the endowment they spend each year to help cover expenses.